New Year’s Communications Resolutions (Should Be Grounded In Last Year’s Data)
A new year, a new set of goals to guide your communications work.
No matter what your New Year’s Communication Resolution, it makes sense to start the year understanding what your major successes were in the previous year – and where there’s still room to grow.
At the end of 2016, each of ReThink Media’s three issue teams held meetings to extensively analyze the past year’s data. Our goal in each case was to identify what content did well, what patterns emerged and what we need to do a better job of promoting. And the analytical discussions informed our goals for 2017.
Once each team reviewed its analytics, our entire staff gathered to share stories about our wins and struggles, compared notes, and worked together to identify strategies to raise up all of our work.
For those of you who have not yet examined your analytics from last year, we hope that this blog post will help you review your top content from 2016.
Website
To start with, we wanted to identify what content on our website performed the best over the past year, since that is where ReThink Media houses most of its strategy memos, messaging guidance, and other proprietary resources. For your organization, we strongly encourage you to check out the traffic to your press page and press releases, as well as reports you issued over the past year.
Google Analytics
To measure this, we use Google Analytics to track these top web pages visited. For those who do not yet have Google Analytics set up, it’s free! You just need to add a bit of code to your website. Also, Google has an excellent (again, free!) web series that teaches you how to effectively use Google Analytics. It’s a must-watch for anyone new to analyzing web traffic.
Some of the top things we used Google Analytics to track included:
- Our most-visited web pages, including the number of visitors, the number of unique visitors, and the amount of time they spent on the page. This helped us learn exactly how many members of the ReThink community accessed the resources we put together, as well as how much time they spent reading it (was it a quick browse or a deep read?). To find this information, we went to the “Behavior” tab, then clicked on “Site Content,” and then “All Pages”.
- Our top blog posts: ReThink Media launched our new communication strategy blog in the summer of 2016. We wanted to see which posts were the most successful in order to better gauge what type of content to continue to produce in the new year. Again, to identify these posts, we went to our most-visited web pages and filtered to those URLs beginning with “/blog”.
- Where our top traffic came from: Did people get to our website from Google searches? From our email newsletters? Social media? By better understanding where our web traffic originated, we can identify which outreach tactics were the most successful (and which didn’t work quite so well). To find this information, go to the “Analytics” tab on the left, then click on “All Traffic” and then “Channels”.
- Further, ReThink has been using Google Analytics’ Campaign Tagging to refine an even better understanding of which outreach methods have gotten the best traction. We use this URL builder to add pieces of code to the URLs we share to track where the traffic came from. (The Google Analytics Academy does a great job of explaining how to do this effectively.) To find these campaigns, go to the “Acquisition” tab on the left, then “Campaigns” and “All Campaigns”.
MailChimp
We use MailChimp as our main email distribution system to send out our morning news clips, the biweekly Echo Chamber newsletters, and our blog digest emails. (Shameless plug: Have you subscribed to our blog yet? Do it here.)
In terms of measuring our analytics and successes, here are some of the things we looked at:
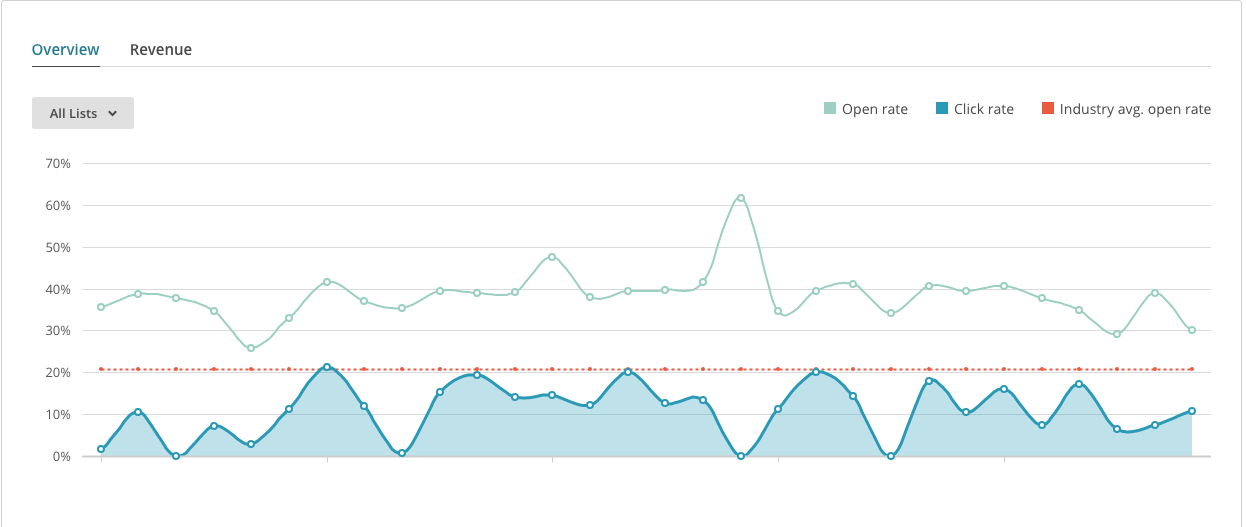
- Our open-rates and click-rates, and how these rates compared to those in our previous Analytics Summits. (We hold these sessions quarterly to measure our specific results.) You can look at this for each individual email (campaign), across a list, or across your whole organization. We mainly looked at these across each email distribution list, as well as an organization-wide look to compare how different lists responded. To find this, click on the “Reports” tab, then filter by whichever list you’d like to analyze, and then download. From there, we open the document as a .csv and look at our average open-rates and click-rates.
- Comparing our open-rates to the MailChimp-provided industry average. It’s always good to know how our campaigns are performing outside of our organizational vacuum. We were thrilled to see that 100% of our newsletters solidly over-performed relative to industry-average emails. (Thanks for being such avid readers!)
- Spot-checking individual emails to see if there were any trends we noticed about what people clicked on. Though MailChimp doesn’t give us an empirical view of the most popular sections of our email newsletters, we can poke through individual emails and look at a click map to see which sections garnered the most clicks. What do those sections have in common?
Twitter Analytics
Twitter’s built-in analytics are fantastic (and also free!). Go to analytics.twitter.com when you’re logged in with your organization’s Twitter handle to see your top tweets (by reach or engagement) and which tweets did not perform quite as well.

What do those tweets have in common? Did they have images? Did they use hashtags? Did they just share an article’s headline, or did they share a unique point of view? Did you @-mention any journalists, influencers, or colleagues? Did you tweet in complete sentences, or were tweets filled with jargon and/or abbreviations? How readable were they? (Click on the “Tweets” tab and then “top tweets” to see the posts that performed the best. Scroll through the tweets to see tweets that didn’t get the same engagement.)
How has your engagement changed over time? Are you getting more or fewer retweets, likes, or replies? What about link clicks? You can find all of this along the right sidebar in the “Tweets” tab.
Click on the “Audiences” tab to better understand the users following your account. What are their interests? Where do they live? How old are they? What’s their level of education? (Full disclosure: These may not be 100% accurate, but they give you a ballpark.)
How has your number of followers changed over the course of the year? What else can you do to continue to boost growth, such as following more relevant users, tweeting more regularly, or using hashtags to tap into new audiences?
Facebook Insights
ReThink Media launched a new Facebook page in 2016, so we are still in the growth stage. (Another shameless plug: Have you “liked” our Facebook page yet?)
But speaking of growth, how many followers do you have, compared with the previous year and what can you do to continue to grow? We’re planning to invite more of our ReThink community members to the page from within the Facebook page to make it even easier for them to “like” it.
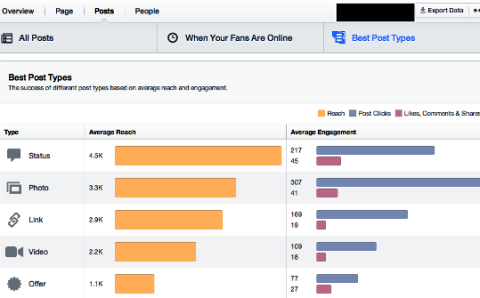
Then click on the “Insights” tab. What have been your most successful posts, in terms of both reach and engagement? What kinds of content performed the best (links, photos, videos, or plain text)?

What do the posts that did well have in common? What kind of language did you use? How long were your status updates? What action did you encourage users to take?
Ask the same questions of the posts that were not as successful. What strategies can you try to see if it helps improve engagement?
Setting Goals
Once you’ve looked at all of this data, it’s time to set your communications goals for the new year.
Some of our own goals include:
- Better engagement with “influencers” (cultural leaders, experts, and other influencers);
- Continuing to build relationships with key journalists via Twitter;
- Consistently using the Google Analytics Campaign Tagging to measure our traffic and outreach;
- Making sure that the impact of all of the resources we distribute are measurable;
- Creating more compelling visual content to use across Facebook, Twitter, our blog, and everywhere else; and
- Featuring more guest blog posts from our community members (Want to write a guest blog post? Contact Dorry!).
What are your communication goals this year? Tweet to @rethink_media and let us know!


